Catholic Medical Quarterly Volume 63(1) February 2013
The Crisis of Declining Human Fertility
Andrew Pollard
A condensed version of this article can be
found
here
A PDF version of the condensed article can be found by clicking
here
 After
obtaining a degree in economics, Andrew Pollard taught in
Further Education for some years before joining The Open
University as an academic. There he made major contributions to
courses in social sciences and management, including producing
television programmes. After 20 years he left the OU to found a
consultancy focusing on providing business strategy,
intelligence and analysis to private and public sector
organisations, including universities. Part of his consultancy
work has involved demographic analysis.
After
obtaining a degree in economics, Andrew Pollard taught in
Further Education for some years before joining The Open
University as an academic. There he made major contributions to
courses in social sciences and management, including producing
television programmes. After 20 years he left the OU to found a
consultancy focusing on providing business strategy,
intelligence and analysis to private and public sector
organisations, including universities. Part of his consultancy
work has involved demographic analysis.
Introduction: A Conflict of Ideas
In 2011 the world’s population reached 7 billion. By about 2050, according to UN forecasters, that number will have increased to 8.1 billion, or maybe even more. Many consider any further rise to be highly undesirable, while others think the world’s population is already too high. They believe a reduction of the world’s population is urgently required to reduce ‘overpopulation’ and to reduce its effects, such as human induced climate change and unemployment.
This article argues that those who believe in the existence of a world wide population explosion have a inaccurate understanding of demographic realities. And that advocates of population reduction do not fully understand the economic and social consequences of declining populations. It further argues that policies based on these inaccuracies and misunderstandings could lead to damage to economic and social systems in many countries.
This article was completed just after the publication of the report “Ageing in 21st Century” by UNFPA/HelpAge International.[1] This report pointed out that a combination of increasing numbers of elderly in many countries, together with declining fertility, in the context of an economic crisis, will present these countries with major challenges for maintaining future levels of healthcare and pensions.
This article shows that managing these and other challenges will become increasingly more difficult, because declining fertility will, without compensating immigration, eventually reduce the size of the workforce and the tax base that governments will need to manage these challenges. In the 21st century understanding fertility trends is crucial for understanding the nature of the “time bombs” facing many countries and for identifying if, and how, they may be defused.
The data for this article comes largely from United Nations sources.
Current trends in human fertility
In the last 12 years, according to the UN, the world’s population rose by 1 billion. [2]. It is currently rising by about 78 million a year, or by about 1%. To understand the current and future trends in population throughout the world we need to examine the underlying trends in fertility, using the total fertility rate (TFR), which measures the number of children a couple have in their lifetime. A minimum TFR of 2.0 is needed for couples to reproduce themselves over one generation. The replacement level TFR is affected by death rates before and during reproductive age. It is lower in developed countries (about 2.1) and higher in less developed countries (above 2.5). For the purposes of this article the replacement level of the TFR is assumed to be 2.2.
What are the main trends in the total fertility rate throughout the world?
1.. The world TFR has fallen and is close to replacement level
In 2011 the TFR for the world as a whole was 2.46, having fallen from 2.59 in the previous five years. The UN forecasts that, according to its low fertility forecast, the world TFR will fall below 2.2 in about five years time, between 2015-20. According to their medium fertility forecast the world TFR will fall below 2.2 in about 30 years time between 2040-2045. Given the recent trends in fertility, the UN’s low fertility forecast is probably the most realistic forecast.
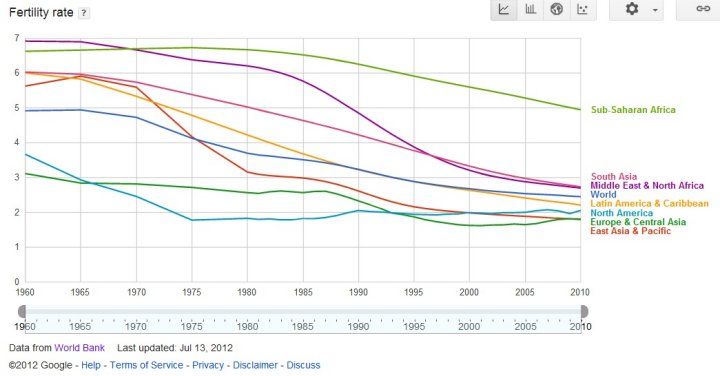
Figure 1 shows significant falls in TFR in all regions of the world, although the poorest part of the world (Sub Saharan Africa) still maintains a high but declining level of fertility. [3] .
2. Many countries already have below replacement TFR
In recent years TFR’s for almost all countries in the world have been declining. Half of the world’s population (49.7%) now live in countries with below replacement fertility (below 2.2) - a total of 104 (47%) out of the 223 of the nations for which data is available [4]. Five of the largest 10 countries in the world currently have TFR’s below 2.2:
| TFR | Population (Million) | |
| China | 1.55 | 1,343 |
| United States | 2.06 | 314 |
| Brazil | 2.16 | 206 |
| Russia | 1.43 | 138 |
| Japan | 1.39 | 127 |
An additional 30% of the world’s population live in countries where fertility is falling and will on present trends fall below replacement level within the next 5-10 years. If we widen the picture and look at the 20 largest countries in the world, which together account for over two thirds of the world’s population, the situation in 2012 was as follows:
- 10 of the 20 countries have below replacement TFRs
- India and Bangladesh (20% of the world’s population), had TFRs below 2.6 and falling.
3. A minority of countries have high TFR’s above 2.7
About 20% of the world’s population live in 75 countries with high TFR’s above 2.7 [4], which is 0.5 above replacement. Most of these are in Africa. Of the 20 nations with the highest TFR all but Afghanistan & Timor are in Africa. The four largest countries with TFRs above 2.7 are in order of size of population:
| TFR | Population (millions) | |
| Pakistan | 3.1 | 190 |
| Nigeria | 5.4 | 170 |
| Philippines | 3.2 | 104 |
| Ethiopia | 5.4 | 91 |
Only 3% of the world’s population live in countries where the population is growing more than 3% per year. Of the 75 countries mentioned above, 23 countries, which together amount to 10% of the world’s population, have Muslim majorities. Fourteen of the 75 countries, which account for 3% of the world’s population, have Catholic majorities.
Case Studies IN FERTILITY DECLINE
EUROPE, AFRICA, CHINA &
INDIA
Let us take a look at some particular parts of the world to illustrate different fertility and population trends.
Europe
Europe’s population, excluding Russia, was about 573 million in 2012, which accounted for 8% of world population. It recorded a very small yearly increase in total population, an increase only possible because net migration was about one million a year. Without substantial immigration, Europe’s population would be falling by nearly 1 million a year. In 2012 only the Faroe Islands, with a population of just 50,000 had above replacement fertility. TFR’s for all other European countries were below 2.09 and almost all are below 2.0. Some TFRs are just 1.3 (Italy and five eastern European countries, including Poland). On present trends, Europe’s population will fall in the future without large scale immigration.
Africa
The continent of Africa contains 15% of the world’s population. A third of Africa’s population of 1 billion live in 13 countries with very high TFR’s – 5.0 and over. But these countries account for only 5% of the world’s population. Two African countries in 2011, Algeria and Tunisia, already had below replacement fertility. Three southern African countries, including South Africa, have TFR’s of 2.3-2.5. In a few years, based on recent trends, about 13% of Africa’s population will be in countries with below replacement fertility. It is important to note that in countries with higher infant mortality and also high rates of HIV, a much higher TFR is required to maintain population size. Population growth in southern Africa has declined significantly and is expected to remain only just above zero due largely to high levels of deaths from HIV/AIDS. The UN forecast a decline in the population of South Africa to begin between 2030 and 2035.[5]
China
China’s population at 1.3 billion is the largest in the world. In 2011 its TFR was 1.5. Births were about 16 million and deaths about 9 million. Abortions were about 10 million. Since 1978, the Chinese government has implemented a one-child policy in China, backed up in some cases by forcible abortion. The UN forecasts that China’s population will fall by over 200 million by 2050 and by 2100 it will have fallen to 500 million, less than half of what it is today [6].
Chinese economists have observed that China will “grow old before it grows rich”. China’s population, according to the UN forecasts, will peak in 2030-2035 according to their medium fertility forecast, or will peak much earlier between 2015-2020 according to their low fertility forecast. By 2050 China will have lost between 45-211 million of its population, according to the UN, depending on which forecast is chosen. The sex ratio at birth in China is 120 males per 100 females – the normal ratio in other countries is about 105:100). [7] The consequences of the one child policy for the future population and economy of China are potentially very serious.
India
India is the world’s second largest country after China, with a population in 2011 of 1.2 billion. This makes India a crucial country for understanding world fertility trends in the future. India’s TFR in 2011 was 2.6, but this masks substantial regional variations within India. Ten of the 20 largest Indian states, which accounted for 40% of India’s total population in 2011, already had below replacement fertility. [8]
Four other states of the 20 largest Indian states, accounting for about 13% of India’s population, have TFRs of 2.4-2.6. In the next few years, based on recent trends, the TFRs for these four states are likely to fall under 2.2. When that happens the TFR for India as a whole will have dipped below replacement fertility, and the TFR’s of the largest two countries in the world, China & India which together amount to about 36% of the world’s population, will be below replacement.
Abortion is a major factor in depressing fertility in India. The highest abortion rates in India in 2007 (the latest figures available) were in Kolkata (20%) and Chennai (13%). In some Indian states the abortion rate is increased significantly by “female foeticide” – the abortion of girl babies because they are girls. This is a practice which continues despite legal sanctions against medical staff revealing the sex of the unborn child and surprise “raids” by the authorities on clinics.
The level of “female foeticide” in India is revealed by the reduced female:male sex ratios at birth. Throughout the world the normal female:male ratio at birth is about 943. The Indian Census, carried out in 2011, found the ratio for India as a whole for the 0-6 age group was 914, having fallen from 945 in 1991. Three Indian states with the lowest sex ratios for the 0-6 age group, and therefore by implication the highest levels of “female foeticide”, were:
- Haryana – 830
- Punjab – 846
- Jammu & Kashmir – 859
For instance, the number of female babies born in Haryana in 2011 was 12% lower than would have occurred if the state had a “normal” sex ratio
What has caused declining fertility in the last 50 years?
Why has human fertility fallen so substantially in the last 50 years and continues to do so today in most countries? Declining fertility throughout the world has been largely driven by increasing contraception, sterilisation and abortion. In Western countries, the decline in fertility has been driven largely by a range of social, economic and attitudinal factors, such as:
- increasing affluence
- later marriage
- provision of healthcare services designed to facilitate access to contraception etc.
Increasing contraception has itself been driven by such variables as female participation in the paid workforce and by the level of tertiary education enjoyed by women. About one woman in five aged 45 in UK, according to the Office for National Statistics, is said to be childless.
In Russia and Eastern Europe the major driver of lower fertility has been abortions. According to the UN, Russia has the highest level of abortions per 1,000 women in the world, 50% higher than the next highest country – Vietnam.[9] The number of abortions in Russia has declined from the much higher levels which prevailed in the USSR in the 1960’s. According to the UN, about 45-50% of all pregnancies in Russia in 2009 ended in abortions. Many Russian women have several abortions in their lives, though in recent years the use of contraceptives is reported to have increased.
Consequences of population reduction
The social and economic consequences of declining fertility are significant. Many people do not appear to realise that fertility below replacement poses a major potential threat to the economies of many countries and to their standards of living, particularly those countries such as the UK which have had below replacement fertility for a substantial number of years[10].
We have already discussed the global decline in total fertility rates towards below replacement level and noted that, in societies where longevity is increasing, the onset of population decline may be delayed for a while, even though working age populations may fall sooner, depending on levels of immigration. Before the total population of a country falls, lower fertility reduces the working populations of countries, with significant consequences for taxation, pensions, welfare and other issues.
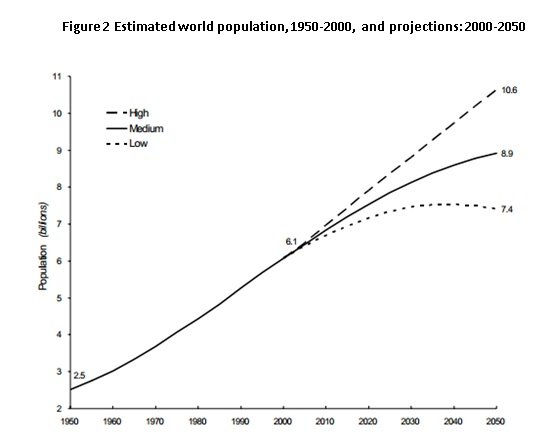
In 2011, according to the World Bank [11], there were 40 countries with zero or negative population growth. Their combined population is 366 million or about 5% of world population. In addition to the 40 countries another 39 countries had population growth rates below 0.5% and are very likely to experience declining populations before 2050. By that time about 33% of the world’s population will live in countries where its population is falling, unless there is substantial immigration into these countries. The UN has estimated that Russia & Japan’s populations are both likely to be about 24% lower by 2050. Romania will also have lost about a quarter of its population. According to the UN low fertility population forecast, the world’s TFR will fall below 2.2 – replacement level – between 2015-2020 and by 2050 will be 1.7. By that time the total world population will be falling, as illustrated in Figure 2.
Case Studies in population decline
Japan, Russia and UK
Japan
Japan, until recently the world’s second largest economy, had about 1m births in 2011 but 1.1 million deaths. It also has about 1 million abortions each year. As net migration in Japan is zero the population of the country has been falling by about 100,000 a year. Projections by researchers at the National Institute of Population and Social Security Research suggest that by 2055 the number of people in Japan will have declined by about a third to just under 90m – a level last seen in 1955. [12] According to the Financial Times there is in Japan “a desperate shortage of Japanese people willing to care for the elderly” [13]
Russia
Russia’s situation is much more parlous than that of Japan. The Russian population is declining by about 700,000 per year because births at 1.6m are substantially lower than deaths at 2.3m, and net migration is only +40,000. The Russian government, responding to this demographic crisis, is eager to boost the level of births in Russia. Couples in Russia having a baby receive a lump sum state grant of £8,500.
UK
In the UK had the level of fertility which existed in the early 1960’s been maintained in the following years very roughly another 20 million children would have been born than were actually born. Instead, there have been over 7 million abortions [14] and so, very roughly, another 13 million children have been not been born because of contraception and sterilisation. Lower fertility in the UK has led to gaps in the workforce which has contributed to a significant rise in the number of immigrants entering the UK. Immigration has been essential to prevent the UK’s total and working population from falling.
Negative consequences of lower fertility
Today, western countries face the prospect of fewer taxpayers supporting more elderly. This will inevitably lead to higher taxes or lower levels of healthcare or lower pensions – possibly all three. When it comes to receiving free state healthcare, those who voluntarily had fewer than two children will still expect to receive adequate levels of care. But they are in fact dependent on the fertility of other people.
We are only now just beginning to realise that while lower fertility can apparently benefit individuals and society as a whole, it also leads to unintended costs and negative consequences, which may over time substantially outweigh the benefits for individuals and society. The key question to ask is: who pays the ultimate costs of lower fertility and suffers its negative consequences? Because someone will inevitably have to pay the price for the lower fertility of recent generations – possibly our children and grandchildren. The benefits to the UK from hard working, tax paying immigrants have to be partly paid for by a poor country losing these immigrants to richer countries with lower fertility. Poland, a poorer country than the UK, with a smaller population than the UK, and with a declining population, has lost over 2 million of its population since it joined the EU in 2004, many of whom have moved to the UK. A fall in fertility in the richer countries has led to a loss of skilled hardworking labour by poorer countries.
In the absence of substantial immigration of people willing and able to work in the caring professions, some of the negative consequences of declining fertility are likely to be borne by the elderly who receive lower quality healthcare because of a shortage of caring staff, due in part to a lower level of births in the past. These consequences will also be borne by the ill and infirm because government tax income is insufficient to support them with appropriate levels of care because there are insufficient taxpayers to pay for healthcare for increasing numbers of elderly. There are already over 10 million people in the UK over the age of 65, and the numbers are rising substantially every year.
Countries like the UK with below replacement fertility have faced a stark choice. Either they accept lower standards of living and care or pass the costs and consequences of their below replacement fertility onto other countries from which they have attracted the immigrants needed to plug the gaps created by lower fertility. This is what North America and Western Europe, including the UK, have done in practice. But this policy cannot go on forever. The costs of below replacement fertility cannot indefinitely be transferred to other countries. There is a limit to the number of hard working skilled immigrants a country like the UK can attract. Either above replacement fertility is restored or a country’s social & economic system will be endangered.
At heart, the UK today is a country with inadequate fertility, “importing” people in order to:
- maintain and even increase its workforce
- increase the level of births from low levels
- pay the taxes to help fund the welfare state
- pay the pensions of the elderly population
If the UK government imposed substantial limits to the immigration of potential taxpayers this would, if combined with below replacement fertility, lead to a decline in the UK workforce and a possible reduction in the government’s tax income. This could lead to:
- A pensions crisis – fewer taxpayers supporting more elderly
- Funding crises for the NHS
- A welfare benefit crisis
In the long term plans for government spending are significantly dependent on:-
- the UK having a high enough fertility to “generate” sufficient indigenous taxpayers to fund these plans, or
- on the UK’s ability to attract sufficient immigrant taxpayers. Fertility levels are critical for the future of the public sector.
Case example - Scotland
Scotland had a falling population from 1974 to 2002. If
population reducers had visited areas like Inverclyde near
Glasgow the one thing that would have struck them was the
absence of prams and small children. Fertility levels in areas
like Inverclyde have been very, very low for some years. But
situations such as those in Inverclyde were not uncommon in
Scotland.
On the other side of Scotland lies Dundee, which until
recently was the largest city in Europe with a declining
population. In recent times Dundee’s population fell by over
30,000.
Scotland’s population decline of nearly a quarter of a
million eventually led to some desperate soul searching. The
result today is that Scotland has an official population policy.
A key part of this policy is that Scotland wants to attract
substantial numbers of immigrants, particularly young foreign
born graduates of Scotland’s universities. The current Scottish
government firmly opposes the UK government’s desire to limit
immigration numbers.
The real demographic time bomb?
Some population pundits say that that the world is suffering from a population explosion and the population needs to be reduced.
From the examination of underlying world wide fertility trends, it does appear that much of the world is on the edge of a potential demographic crisis. But it is not largely, as some pundits appear to think, a population explosion disaster, but a major threat from a substantial world-wide decline in fertility, which is leading more and more countries into a demographic winter of declining and ageing populations. Insufficient births in many western countries is leading to competition between countries for skilled labour resources and the stripping of high quality labour from poorer countries.
The real population“time bomb” is for most parts of the world a “dearth” bomb not a “birth” bomb. Those who advocate lower births so as to reduce a country’s population, such as the UK, need to explain how they will staff the hospitals in the future and how they will fund the Welfare State.
The threat for the most part is not a population explosion bomb but a population time bomb of insufficient fertility. The real population “time bomb” is for most parts of the world a “dearth” bomb not a “birth” bomb. Those who advocate lower births so as to reduce a country’s population, such as the UK, need to explain how they will staff the hospitals in the future and how they will fund the Welfare State. Text Box: The real population “time bomb” is for most parts of the world a “dearth” bomb not a “birth” bomb. Those who advocate lower births so as to reduce a country’s population, such as the UK, need to explain how they will staff the hospitals in the future and how they will fund the Welfare State.
According to population reducers, some people have too many children, which they variously define as more than one or more than two children. Such behaviour is described as “irresponsible and unethical”. But reducing the number of births or immigration significantly will in time reduce the number of future taxpayers. Those advocating a reduction in population need to spell out where the money is going to come from in the future to pay for state services such as health, education and social security. Those that are likely to suffer most are the poor as they are dependent on what the state can provide them.
Population reduction could lead to the end of the Welfare State as we know it today. The number of elderly in western countries is rising substantially. If births and immigration are to be substantially reduced who will look after the elderly in the future? We should look at the consequences of the “one-child” policy in China – a situation described by the Chinese as the “4/2/1 problem”: 4 grandparents and 2 parents all depending on one child to support them in their old age.
EconEconomnic consequences of population reduction
We should be aware therefore that a declining population will make much more difficult what is already difficult to do. A few examples demonstrate this.
Example 1: Government Debts
Reducing the huge government debts which have been accumulated since 2007, is going to be much harder to do, if not ultimately impossible, with fewer taxpayers. If population reduction reduces the number of taxpayers how will governments repay the huge debts it has accumulated?
Example 2: Care for the elderly
Recent reports on elderly care in some NHS hospitals have revealed how poorly some elderly patients are currently being treated. One reason given for inadequate care levels has been insufficient numbers of staff. Reducing immigration, a key requirement according to some supporters of population reduction, is likely to lead to an reduction in the levels of care. Population reducers need to explain where the hospital staff are going to come from in the future. They need to explain how they will avoid condemning old people to a life of misery because the funds and staff needed to care for them adequately will not be there for them.
Example 3: FINANCING public services
Public services are considered by most people an essential part of a caring and civilised nation. But without a healthy, working economy they cannot be supported. Consider for influence the impact on the environment of lower numbers of taxpayers.
Case example For many years the River Thames was so polluted that no fish could survive in its waters. So much raw sewage and industrial waste were poured into the river that all natural life was extinguished. But things are getting better. Fish have returned to the Thames. This clean-up shows what can be done if there is the will to get things done. But it also depends on money, usually taxpayers money. Environmental improvements like the River Thames cost many millions which are raised from taxation. Such cleanups would be much more difficult, possibly impossible, with fewer taxpayers, which would be the result of reducing the population.
POPULATION REDUCTION REDUCES THE “DEPENDENCY RATIO”
At the heart of every argument about population there are some simple numbers: births and deaths, and if referring to a single country, immigration and emigration. And there is one key relationship between two numbers: between the number of retired elderly and the number in the workforce paying tax. The number of elderly retired divided by the number of working taxpayers is the dependency ratio. Any increase in the ratio imposes greater tax burdens on the working taxpaying population.
In most countries of the western world the number of retired elderly is rapidly rising because of better medical care, nutrition and also because there was a bulge in births from 1945 to 1964. The retirement of the “baby boomers” is today significantly increasing the dependency ratio. To maintain elderly care at the current standard means a big increase in taxes per taxpaying person and a big increase in the number of carers. If taxes per taxpaying person do not rise and/or there are reductions in the number of foreign born carers that can work in the UK care standards for the elderly will inevitably fall. Population reduction would reduce the future taxpaying working population. By increasing the dependency ratio they would condemn many elderly to a life, at present difficult, but to one in the future which would be much more arduous.
Elderly care, particularly in hospital, involves emptying many bedpans. It is, as we all will appreciate, a labour intensive job. It needs arms and legs to do the work as well as money to pay for the arms and legs. An increase in the number of bedpans in use, because of more bottoms due to more elderly, and a reduction in the number of arms and legs which population reduction will result in, will together lead major hygiene problems. Simply put, population reduction will increase the ratio of bedpans to caring arms and legs. Population reduction policies would in practice lead to a major “Bedpans for Grannies Crisis” in the UK.
TRYING TO ESCAPE THE CONSEQUENCES OF LOWER FERTILITY
Many western countries are currently trying to escape the consequences of low fertility, because they do not want to suffer the consequences of lower fertility and fewer children. Instead they have opened their borders to immigrants to fill the gaps left by lower fertility. Building and construction firms, for instance, have no desire to go out of business because they lack skilled building workers. Hospitals and care homes do not want to close down through lack of medical and caring staff.
Government plans in 2011 to reduce the levels of immigration of skilled workers into the UK from outside the EU are, according to some reports, already having negative consequences, particular on organisations in the IT and life sciences sectors. A report produced for the City of London Corporation in November 2011 [15] stated that businesses in London were postponing plans for expansion and even considering moving operations outside the UK, because of the potential lack of immigrant labour. Businesses are opposed to reducing the number of immigrants, particularly skilled immigrants.
A key question we must always ask whenever anyone proposes reducing the population is “Who will pay?” Who will suffer the damage and pain of lowering the population through lower fertility and/or lower immigration? Who will bear the burden? Who will die because of fewer doctors and nurses? Whose granny will have to suffer ill treatment and personal distress from poor, unhygienic elderly care? How will decisions be made about who benefits and who loses as government funded healthcare declines as the number of taxpayers declines and skilled staff are excluded from working in this country? Government decision making and project implementation is all too frequently a mixture of mistakes, blunders and bureaucratic incompetence. To combine this mixture with the power over life and death can only lead to some awful unintended consequences.
Practical realities of reducing population
We have seen that the impact of reducing the population could be very serious and damaging for the vulnerable and for the viability of the Welfare State as we understand it. In this section we will take a brief look at the practicalities of reducing the population of the UK and of the world. How could such a reduction be carried out? By what means? And what would population reduction mean for individual families?
1. Reducing the UK population
Let us consider the following scenario for the UK. The figures are based on data for 2010.
Objective - Reduce UK population by 150,000 per year (about 0.25%)
To achieve this objective, the UK would have to do two things:
- Make immigration levels equal emigration levels – by reducing immigration by 252,000 or by 43%
- Reduce births by 395,000 from 807,000 to 412,000 or by 49%
This scenario would require an enormous reduction in immigration. It also would require a reduction in the UK TFR from 1.9 to about 1.0, which would require one child per family. How would this be achieved in the UK without some form of coercion? Supporters of population reduction state that they are only in favour of “non-coercive” population reduction policies. But how can a one-child policy be implemented without the use of considerable amounts of government power? Either by compulsory sterilisation and abortion, or by a tax and benefit system which would financially penalise families for having more than one child, or by a combination of both approaches. Is this politically feasible? How would the government stop “female foeticide” which occurs when families, under pressure to have only one child, insist on having a male child? There may also be other unpleasant unintended consequences of such a policy.
Population reducers want to see a reduction in the world’s population and not just in the population of the UK. But have they worked out what would be needed in order to achieve their objective? Let us assume they want to reduce the world’s population by just 5m per year, a number which is less than 0.01% of the current world’s population. Even this apparently very modest objective would require births to fall from around 134 million per annum, which is their present level, to about 51 million - a massive reduction. A TFR of 1.0 would have to be achieved in order to meet this objective. In other words a world wide one child policy would be necessary.
Even if a one child policy could be introduced in every country in the world without substantial government coercion, the economic consequences of a global one child policy would be seriously negative. A brief examination of the effects on China of their one child policy is instructive. China’s economic future is under a significant threat from the consequences of its own one child policy. Moreover, China’s status as a leading economic power is threatened by the rapid ageing of its population caused by its one child policy.
Chen Dening, China’s Minister of Commerce, has stated that his country has only 10 years left before population demographics weaken in terms of employment. Other people say the tipping point has already been reached, or that it will happen about 2015. Chinese demographer Liang Zhongtang forecasts that in 10 years the number of Chinese workers retiring will exceed the number of new workers entering the Chinese workforce by 10 million a year. Other forecasters estimate that China’s workforce will contract from 2017, a year later than the workforce will begin declining in South Korea and Taiwan.
3. Different population situations require different policies
We need to realise that the demographic and economic situation in each of the world’s 238 countries is not the same. A single policy of population reduction is unlikely to be appropriate where there are enormous differences between countries. For instance, there are substantial differences between fast growing Niger in central Africa on the one hand and fast declining Russia or Japan on the other. Three quarters of the UN forecasted 1 billion increase in world population between 2011 and 2050 will be accounted for by countries in sub-Saharan Africa, together with the four largest Muslim countries: Indonesia, Pakistan, Bangladesh and Egypt.
Europe’s population is forecasted to fall by over 100 million by 2050. A single population policy for all countries simply does not make sense. In some countries, governments are already trying to raise their country’s fertility, not to reduce it further.
In many parts of the world, policies to reduce “rapid” population growth are simply inappropriate. If anything, policies should be instigated in many countries to prevent fertility – already very low – from falling further to below replacement levels. An attitude of ‘one policy for completely different situations’ is just not very appropriate.
Take for instance the situation within the UK. The TFR for the UK as a whole is 1.9. But the TFR varies a great deal from one part of the UK to another. Even within London there are big variations in fertility. Newham has the highest TFR in the UK (3.0), whereas Camden, a few miles to the west, has one of the lowest levels of fertility (1.3). How could any population reduction policy aimed at reducing fertility in London not make an already below replacement fertility level in Camden much worse? London as a whole has a higher level of fertility than the North East of England. Despite these realities, population reducers argue for “a national population policy”.
In short, the idea that a country’s population can be reduced painlessly and without government coercion is simply fanciful. Reducing the population in a fair and equitable way is probably a fantasy.
Summary & conclusion
Trends in fertility, causes & effects
Human fertility across the world has substantially declined in recent years. The world total fertility rate (TFR) has fallen significantly and in 2011 was close to replacement level. Nearly 50% of the world’s population now live in countries with below replacement level TFR’s. That number is likely to increase significantly in the coming years. The TFR for China, with the largest population in the world, is already substantially below replacement level. The TFR of India, the second largest country in the world, is likely to dip below replacement in the next few years. Falling fertility, if maintained, leads to falling working and total populations. Countries with falling populations already account for nearly 20% of the world population.
The decline in human fertility has been driven by increasing contraception, sterilisation and abortion, which have themselves been driven by changes in economic and social factors. In western countries lower fertility is the result largely of decisions made by individuals. In China, decisions about fertility have been imposed on the population by the government.
In most parts of the world, there is little evidence of a world-wide population “explosion”. The world’s total population is currently increasing by 1% per year. According to the UN’s low fertility population forecast the world’s population will begin to fall between 2040-2045. Currently, substantial population growth is limited to a minority of countries. Three quarters of the world’s population growth is concentrated in sub-Saharan Africa and in four of the largest Muslim countries outside Africa. Another 24% of the world’s population live in countries with population growth rates lower than 0.5% per year. One in 12 of the world’s population already lives in countries with declining populations. Europe’s population is static and would fall without substantial immigration. China’s population is forecast by the UN to fall by 62% by 2100, according to the UN’s low fertility population forecast, and by 30% according to their medium fertility population forecast.
Declining human fertility and population reduction is already having severe consequences in some countries and in the future the situation will deteriorate further. In the absence of substantial immigration, declining human fertility leads to a decline in working taxpaying populations resulting in lower government income or increased tax burden on fewer taxpayers. Declining human fertility is likely to reduce the size of a country’s economy and to reduce living standards. China’s future economic growth is threatened by the consequences of its one child policy.
Lower government expenditure on health & education will reduce care levels for the sick & elderly. It will also lead to a staffing crisis in hospitals & the closure of wards and perhaps even of entire hospitals. Other consequences are likely to be higher death rates. There will be greater pressure on declining resources making decisions regarding who gets what much more difficult. Rationing of healthcare – and indeed other state provided services such as education – will become a major political challenge.
Some countries, such as UK, are already fighting the consequences of declining fertility. The effect of lower fertility over the last 40 years has meant that this country has found itself increasingly dependent on immigrants. But increasing immigration has costs as well as benefits. We need to realise that immigration into the UK leads to the loss of skilled workforce by poorer countries. Scouring the world for skilled immigrants, as advocated in 2012 by a government minister will not entirely fill the hole in the UK left by years of significantly below replacement fertility.
Without adequate fertility, countries will not have the taxpayers or the arms and legs to provide public services, such as teaching, healthcare or social care for the vulnerable or for the ageing population. If countries do not face up squarely to the reality of the crisis of declining human fertility, the crisis will hit them unprepared.
References
- UNFPA/HelpAge International Report - http://unfpa.org/ageingreport/
- http://www.un.org/apps/news/story.asp?NewsID=40257
- World Bank, International Comparison Program database. http://databank.worldbank.org Click here for worldbank data
- Central Intelligence Agency. www.cia.gov/library/publications/the-world-factbook
- United Nations. Population trends, Africa http://esa.un.org/wpp/unpp/p2k0data.asp
- United Nations http://esa.un.org/wpp/unpp/p2k0data.asp
- Population reference bureau 2012. http://www.prb.org/Articles/2012/china-census-excess-males.aspx
- Census of India - http://planningcommission.nic.in/data/datatable/0904/tab_137.pdf
- Abortion levels - http://data.un.org/Data.aspx?d=GenderStat&f=inID%3A12
- Childless women - http://www.telegraph.co.uk/news/uknews/8191859/One-in-five-women-is-childless-by-age-of-45.html
- World Bank 2012. Population growth http://data.worldbank.org/indicator/SP.POP.GROW?page=1
- Financial Times (2011). Japan: Land of the setting sun. http://www.ft.com/cms/s/0/ae3c735e-f854-11e0-a419-00144feab49a.html#axzz25EiplTPc
- Financial Times. The end of Asia’s demographic dividend. http://www.ft.com/cms/s/0/bd935806-6d00-11e1-a7c7-00144feab49a.html#axzz25EiplTPc
- UK Abortion statistics 1968-2011 Click here for abortion statistics
- City of London report http://www.cityoflondon.gov.uk/business/economic-research-and-information/research-publications/Pages/Access-to-Global-Talent.aspx